How to choose an optical imaging system
for recording fast brain activity.
Optical imaging technologies are becoming
more widely used in the fields of Cardioscience and Physiology, with
more optical imaging systems becoming available. To choose an appropriate
system for one's application the following aspects should be considered:
Dynamic Range and Signal-to-Noise Ratio
An important figure of merit for an optical
recording system is dynamic range. Dynamic range can be specified
in db, in bits, or as an exponent (e.g. 100 db = 17 bits = 105
). The dynamic range determines the size of smallest fractional intensity
change that can be measured. For example, a dynamic range of 100 db
would allow one to measure a signal with a fractional change,  I/I, of 10-5. The smallest
signal that can be measured with a dynamic range of 60 db is 10-3.
Quite often, optical signals of biological interest are small (10-2
- 10-4). A large dynamic range ensures that the apparatus
can measure small signals with an optimal signal-to-noise ratio. I/I, of 10-5. The smallest
signal that can be measured with a dynamic range of 60 db is 10-3.
Quite often, optical signals of biological interest are small (10-2
- 10-4). A large dynamic range ensures that the apparatus
can measure small signals with an optimal signal-to-noise ratio.
The signal-to-noise ratio is linearly related to the light intensity
when dark noise dominates (low light) and linearly related to the
square root of the light intensity when shot noise dominates (high
light). At low light levels, as in measurements from an individual
cell stained with a fluorescent dye, the performance of a cooled CCD
camera (CardioCCD) is better than the CardioPDA (photodiode array).
But unlike a CCD camera, the diodes won't saturate at high light levels,
as in fluorescence or absorption measurements from an intact heart.
As a result, photodiode systems with parallel amplification generally
have a larger dynamic range, thereby yielding a better signal-to-noise
ratio at high light levels. While the dynamic range cannot be larger
than the effective resolution of the analogue-to-digital converter,
it can be considerably smaller if, for example, saturation in the
photodetector limits the number of measured photons. Dynamic range
can also be reduced by extraneous noise. Base-line subtraction (e.g.
by AC coupling) in individual channels improves the effective a-to-d
resolution and can increase the dynamic range.
The following is a listing of the dynamic
range required for several voltage-sensitive-dye applications:
� Population signals from intact brains and
brain slices -- 12-15 bits.
� Multiple individual neurons in invertebrates -- 15-17 bits.
� Multiple sites on a single cell -- 12 bits.
� Tissue cultured neurons -- 12-17 bits.
� Intact hearts -- 10 bits.
Dark Noise
The dark noise (the noise of the system with no light) affects the
signal-to-noise ratio at low light levels. The dark noise is lowest
in a cooled CCD. Photodiodes and noncooled CCDs have a larger
dark noise.
Temporal Resolution (Frame Rate)
A frame rate of at least 1 kHz is required
for recording action potentials and other fast neuronal or cardiac
signals.
Spatial Resolution
Good spatial resolution is important for
obtaining a high quality image of activity. In general, increasing
the number of pixels will increase the spatial resolution. However,
in many preparations, light scattering or signals from out-of-focus
light are substantial. Thus, a large number of pixels may not actually
increase the spatial resolution, but rather will only reduce the
amount of photons each pixel receives, thereby reducing the signal-to-noise
ratio.
Software
The software should be comprehensive and
easy to use.
For additional reading, see:
- Wu, J-Y. and Cohen, L.B. (1993). Fast multisite optical measurement
of membrane potential. In: Fluorescent and Luminescent Probes for
Biological Activity, W.T. Mason eds, Academic Press, London. pp
389-404.
- Grinvald, A., Frostig, R.D., Lieke E. and Hildesheim, R. (1988).
Optical imaging of neuronal activity. Physiological Reviews, 68(4):
1285-1365.
Optimal Use of the CCD Camera
The S/N ratio at moderate and high light levels
is the square root of the light intensity. To increase the S/N one
should pump in (and collect) as much light as possible at the lowest
gain (1X). Only at this gain (1X) one uses the full well-size of the
CCD and this is the preferred mode of measurement for most bath-stained
tissue, such as brain slices and cardiac preparations. The saturation
at higher gains (>=3X) is probably amplifier saturation. If saturation
occurs at 1X, try to use a higher frame rate (up to 2KHz for the CardioCCD-SMQ,
100Hz for the CardioCCD-SM256, unbinned). This will allow emptying
the CCD wells faster, thus avoid saturation w/o losing light. One
can temporally bin the data later to increase the S/N ratio. If saturation
still occurs when using the highest frame rate, one will have to reduce
the illumination. Higher gains should be used at dim light levels
to better utilize the 14-bit digitization.
Comparing signals and images from a 2-photon
microscope and an ordinary fluorescence microscope (equipped with
a CardioCCD-SMQ camera)
A. Calcium Green-1 signals measured with a
2-photon microscope and an ordinary fluorescence microscope with a
CardioCCD-SMQ camera
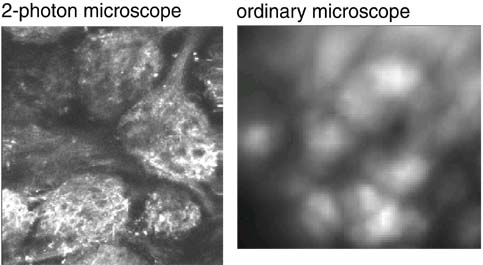
B. Images
Olfactory receptor neuron nerve terminals
in the mouse olfactory bulb were stained with Calcium Green-1.
Figure A. at top shows odorant elicited signals
in in vivo preparations using the two imaging systems; in both cases
the signals were the spatial average of the light from one glomerulus.
The signal-to-noise ratio for the CardioCCD-SMQ recording is much
larger. This results from a larger number of measured photons in the
CardioCCD-SMQ recording. Similar results were obtained in comparisons
made on five mice.
Moreover, four trials were averaged
in the 2-photon measurement shown in the figure while the result
from CardioCCD was from a single trial. In addition, the numerical
aperture (NA) of the lens used for the 2-photon measurement was
0.8 while that used in the ordinary microscope was only 0.5. If
a correction for these two factors is applied, the 2-photon measurement
would have a signal-to-noise ratio six times smaller than that shown.
Factors that contribute to the relatively
small number of photons in the 2-photon measurement are:
1. The incident light in the 2-photon microscope
interacts with many fewer dye molecules because only a thin section
receives high intensity illumination.
2. Calcium Green-1 has a 2-photon cross section which results in
a low optical efficiency. This low efficiency can not be overcome
by increasing the incident intensity because higher intensity will
heat the preparation.
The images formed by the two kinds of microscope are shown in the
bottom figure B. (the image made with the ordinary microscope covers
a 2x larger area of the bulb). The 2-photon image is the total intensity;
the ordinary microscope image is the image of the signal. The advantages
of 2-photon microscopy are clear; rejection of scattered light and
very shallow depth of focus results in much better x-y and z-axis
resolution. Clearly the two kinds of imaging systems are optimal
for different niches in the parameter space of imaging.
The olfactory receptor neuron staining procedure in the mouse (Wachowiak
and Cohen, 2001) followed one developed by Friedrich and Korsching
(1997) for zebrafish. (Data provided by Rainer Friedrich, Matt Wachowiak
and Larry Cohen, Max Planck Institute for Medical Research, Heidelberg,
and Yale University, New Haven.)
|