|


EMCCD CAMERAS
EMCCDs have an on-chip electron multiplying stage designed
to effectively reduce the read noise to zero. One drawback of this kind of
multiplication is that it adds a noise factor of 1.4. In addition to this factor there is
excess noise due to spurious charge generated by simply shifting the readout
register. More information about EMCCD cameras and how they compares to CCDs can be found here.
The CardioCCD-SMQ has a read noise of 12 e- at a frame rate of 2000 Hz. A
noiseless EMCCD would thus have lower noise than the CardioCCD-SMQ at photon
counts of 100 photons/pixel/frame. With the excess noise of the EMCCD this
crossover occurs at even lower photon counts. Most neurobiology and cardiology
applications have photon counts of >>100 photons/pixel/frame. Signal-to-Noise Ratio Comparison of CardioCCD-SMQ and EMCCD The
following graph compares the singal-to noise ratio (SNR) of the
cardioCCD-SMQ and of an EMCCD camera, at low light levels, at 500HZ : 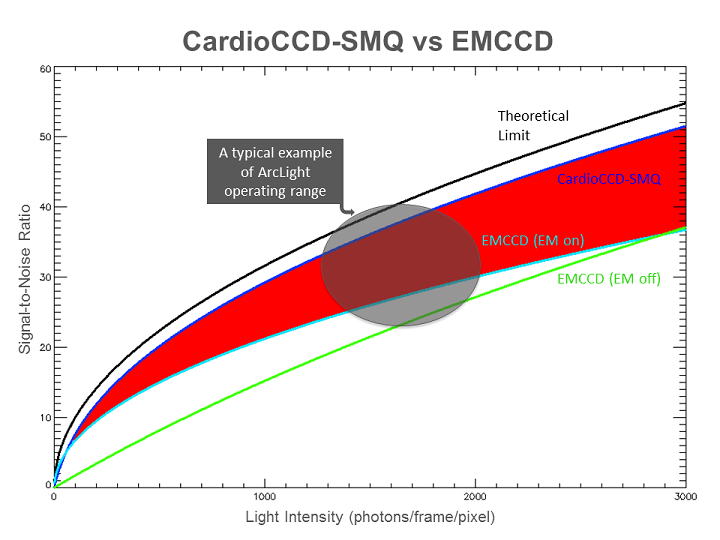
| Algorithm:
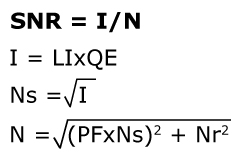
Where:
I –
Effective Light Intensity, LI – Light Intensity,
N – Noise
(RMS), Ns – Shot Noise, Nr – Read Noise,
QE – Quantum
Efficiency, PF – Penalty Factor (shot noise)
| | Theoretical
Limit | : | QE
- 100%, ReadNoise - 0e-, No Shot Noise Penalty factor (PF = 1.0); | | CardioCCD-SMQ | : | QE
- 90%, ReadNoise - 6.5-7e- (at 500fps, 30X & 10X gain), No Shot Noise
Penalty factor (PF= 1.0); | | EMCCD | : | QE
- 90% | | EM
on | : | ReadNoise
- 0e- + extraneous noise (0 is used), Shot Noise Penalty factor >= ( is
used); ( is
used); | | EM
off | : | ReadNoise
- 51e-, No Shot Noise Penalty factor (PF= 1.0);
| | | |
| | 
A typical example of ArcLight operating range for
Drosophila is conceptually placed in the graph based on
the photon measurement
and DF/F of 5-10% using the optimal setting of the cardioCCD-SMQ system.
| | | 
The Red region shows the S/N advantage of CardioCCD-SMQ
over EMCCD (EM on). EMCCD (EM on) has advantage over CardioCCD-SMQ
when photons/frame/pixel is
less than 100e- (near the origin).
|
|
Signal-to-Noise Ratio Comparison of CardioPDA
and CardioCCD
In terms of signal-to-noise ratio the best a camera
system can do is to approach the shot-noise limit. Some of the factors
in the camera design affect how close the camera approaches shot-noise
performance and others affect the range of light intensities over
which this performance is achieved. In addition, extraneous factors
can make the performance worse than the shot-noise limit.
Shot Noise
The limit of accuracy with which light can
be measured is set by the shot noise arising from the statistical
nature of photon emission and detection. Fluctuations in the number
of photons emitted per unit time will occur, and, if an ideal light
source emits an average of N photons/ms, the root- mean-square deviation
in the number emitted is the square root of N. The effects of this
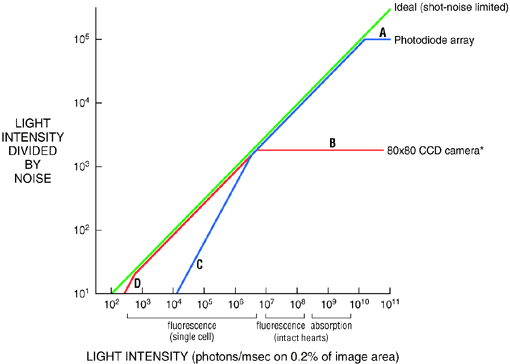
relationship are indicated by the green line in the Figure which
plots the light intensity divided by the noise versus the number
of photons measured per ms. At high intensities this ratio is large
and thus small changes in intensity can be detected. For example,
at 1010 photons/ms a fractional intensity change of 0.1%
can be measured with a signal-to-noise ratio of 100. On the other
hand, at low intensities this ratio of intensity divided by noise
is small and only large signals can be detected. For example, at
104 photons/msec the same fractional change of 0.1% can
be measured with a signal-to-noise ratio of 1 only after averaging
100 trials.
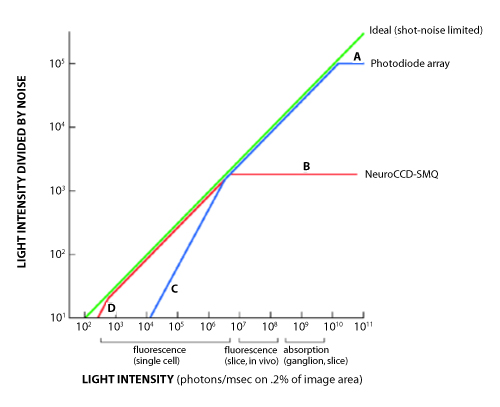
The figure also indicates the performance
of the two RedShirtImaging systems, the photodiode array system
(CardioPDA; blue line )
and the CCD camera system (CardioCCD; red
line). CardioPDA approaches the shot-noise
limitation over the range of intensities from 3x10⁶ to
1010 photons/ms. This is the range of intensities obtained
in absorption measurements and fluorescence measurements on intact
hearts. On the other hand, CardioCCD approaches the shot noise limit
over the range of intensities from 5x10³ to 5x10⁶
photons/ms. This is the range of intensities obtained from fluorescence
experiments on individual cells.
Saturation
The high intensity limit of the CardioCCD
is set by the light intensity which fills the electron wells on
the CCD chip. This accounts for the bending over of the camera performance
at segment B in the Figure. Even though the CardioCCD camera has
a large well-size compared to other CCD cameras, it will not be
optimal for measurements of absorption or fluorescence measurements
on in vitro slices and intact brains. The light intensity would
have to be reduced with a consequent decrease in signal-to-noise
ratio.
The CardioCCD saturates at light levels that result in resting light
intensity readings of 0.3 volts at 1 Gohm on CardioPDA. In fact,
the CardioCCD saturates at about the light intensity where the CardioPDA
becomes shot-noise limited. Thus, as indicated in the figure, the
range of light intensities where the two systems are optimal have
very little overlap.
Dark Noise
Dark noise will degrade the signal-to-noise
ratio at low light levels. Because the CardioCCD is a cooled CCD
camera, its dark noise is much lower than that of the CardioPDA.
The excess dark noise in CardioPDA accounts for the fact that segment
C (for CardioPDA) in the Figure is substantially to the right of
segment D (for the CardioCCD). The dark noise of the CardioCCD is
lower than other commercially available CCD's in its performance
range.
Extraneous Noise
A second type of noise, termed extraneous
or technical noise, is apparent at higher light intensities where
the sensitivity of the measurement is high because the fractional
shot noise is low. There are several sources of extraneous noise.
One type is caused by fluctuations in the output of the light source.
Other sources are vibrations and movement of the preparation. Extraneous
noise accounts for the break in the CardioPDA curve at A.
|