The
analytical objectives of the CardioPlex analysis software are to
identify and characterize the variety of dynamic spatial patterns in
cardiac tissue. This analysis is made of 3 interfaces.
General
Interface

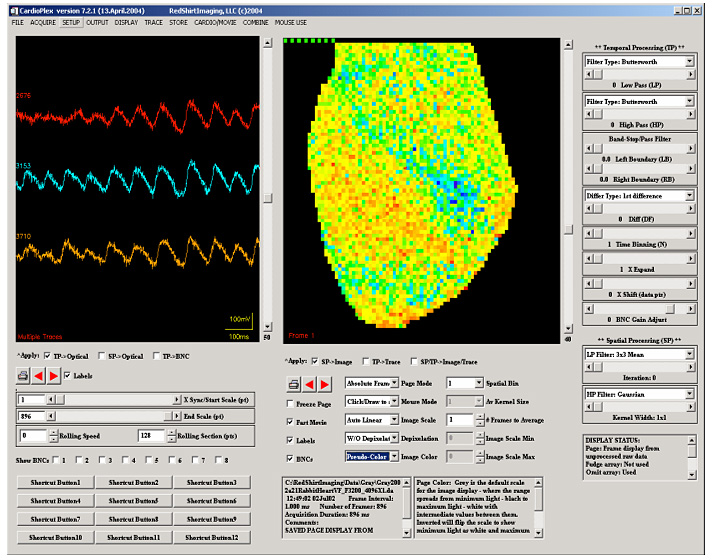
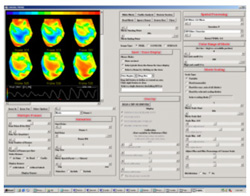
 The first user
interface is the primary CardioPlex interface (shown at right). It
contains two windows for viewing data. The right window, called the Page
Display, displays data from all pixels as they are positioned
in the array. The Trace Display (left window)
provides intensity-versus-time traces from a reduced number of pixels,
groupings of pixels, or electrode inputs. Pixels can be selected for
the Trace Display by pointing and clicking on the Page Display. A
variety of low- and high-pass filters and display adjustments are
available for each display. In particular, the two displays can be
filtered and processed separately for ease of inspection, before the
full spatiotemporal processing of the whole recording. Additional
controls are available for averaging over pixels, superimposing, and
scaling traces.
The first user
interface is the primary CardioPlex interface (shown at right). It
contains two windows for viewing data. The right window, called the Page
Display, displays data from all pixels as they are positioned
in the array. The Trace Display (left window)
provides intensity-versus-time traces from a reduced number of pixels,
groupings of pixels, or electrode inputs. Pixels can be selected for
the Trace Display by pointing and clicking on the Page Display. A
variety of low- and high-pass filters and display adjustments are
available for each display. In particular, the two displays can be
filtered and processed separately for ease of inspection, before the
full spatiotemporal processing of the whole recording. Additional
controls are available for averaging over pixels, superimposing, and
scaling traces.
Trace
Display (Intensity versus Time):
Traces can be displayed as intensity change ( I)
versus time or as fractional intensity change (I/I)
versus time. Segments of the traces may be expanded graphically to
focus on critical features. I)
versus time or as fractional intensity change (I/I)
versus time. Segments of the traces may be expanded graphically to
focus on critical features.
The Trace Display can display:
1. Traces from individual pixels
2. The spatial averages of selected pixels
3. The FFT of selected traces,
4. The correlation between traces, and
5. Separated or superimposed traces. Superimposed traces can be scaled
to equal height for comparing time courses.
Page Display (Spatial Array):
The
Page Display can display an array of intensity-versus-time traces for
all pixels. The Page Display can also display gray scale or pseudocolor
images of the Resting Light Intensity or intensity differences between
user selected frames. Multiple groups of pixels may be identified and
color-coded on the Page Display; the corresponding individual or
average traces appear in the Trace Display. An omit array may be
created to exclude selected pixels from the display and analysis. An
option is available to replace bad pixels with the average of the four
adjacent pixels. The Page Display can display:
1. A map of Traces
2. Differences between user selected frames
3. RMS Noise Levels
4. Light Intensities relative to a Dark Frame (Resting Light Intensity)
Filtering:
The following
kinds of temporal high- and/or low- pass filtering are available:
· Gaussian,
· Butterworth,
· Bessel
· median,
· binomial, and
· tau
In addition, spatial
filtering options include up to 10 iterations of a 3x3 Median, 3x3
Mean, or 5x5 Gaussian low-pass filter and a variable-width Gaussian
high-pass filter.
Other
Options:
Both the Page
Display and the Trace Display can be exported as TIFF, PostScript, or
ASCII files.
Cardio/Movie
The analytical
process continues with a Movie of the surface membrane potential,
progressing for up to 10240 frames. For immediate review, a grey-scale
image of unfiltered data may be scanned by scrolling manually using the
Scan feature.
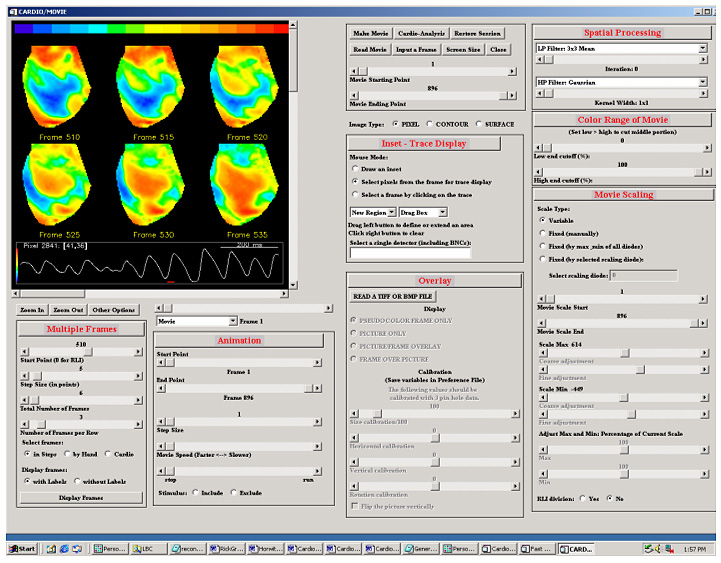
 The
second analysis interface within CardioPlex is the Cardio/Movie
interface. It provides pseudo-color displays of the data (shown at
right). Pseudo-color images may be displayed as single frames, multiple
frame layouts, and as an animated movie. The color-coded pixel
intensities may be displayed directly, as contour plots, or as surfaces
in 3D. A variety of color schemes, scaling, and filtering options are
available. A trace inset is available to link the current movie frame
to a time series for an individual pixel or group of pixels. The
second analysis interface within CardioPlex is the Cardio/Movie
interface. It provides pseudo-color displays of the data (shown at
right). Pseudo-color images may be displayed as single frames, multiple
frame layouts, and as an animated movie. The color-coded pixel
intensities may be displayed directly, as contour plots, or as surfaces
in 3D. A variety of color schemes, scaling, and filtering options are
available. A trace inset is available to link the current movie frame
to a time series for an individual pixel or group of pixels.
Trace Inset:
The Trace Inset
supplies an intensity-versus-time plot for an individual or group of
pixels selected from the pseudo-color movie frame on display. A red
bead on the trace identifies the current frame while the movie is
running. A frame may be selected by clicking on the trace inset, as
well.
Multiple
Frame Layouts:
Primary movie
frames may be selected in regular sequences automatically or manually
edited to select irregular sequences for simultaneous display in the
movie window. Special CardioAnalysis frames may be associated by frame
number or frame type in various patterns and accumulated in an editable
list for simultaneous display.
Spatial
Filtering:
Spatial smoothing
and filtering options for the pseudo-color images include up to 10
iterations of a 3x3 Median, 3x3 Mean, or 5x5 Gaussian low-pass filter
and a variable-width Gaussian high-pass filter.
Overlay
of grey-scale Image:
For anatomical reference, a grey-scale image of the preparation,
imported as a TIFF or BMP file, can be overlaid on the pseudo-color
images.
Pseudo-Color
Scaling:
The pseudo-color scaling of the frames can be manipulated by using
different color tables and four different scaling schemes:
The scaling schemes are:
1. Variable (with each detector scaled individually to a standard
range);
2. Fixed, using the overall minimum and maximum among all traces;
3. Fixed, using the range of a user-chosen detector for all traces; and
4. Manual.
(When you've tried all these options, it will be clear why it's called
pseudo-color - as in "lies, damn lies, and pseudo-color").
Other
Options:
The movie can be saved as a movie file and the file can then be read
and replayed by CardioPlex. The display on the movie window can be
exported (in color or grey-scale) as a TIFF file and a sequences of
frames from the movie may be exported as a TIFF-Stack or MPEG file.
|