Main
Features:
Includes
routines for:
·
Examining intensity versus time for individual pixels or spatial
averages of pixels.
· Examining intensity versus time for all pixels.
· Many filtering and comparison options are available for both of the
above.
· Images of frame subtractions to provide maps of the signals. Movies
to display signal propagation.
User
Interface
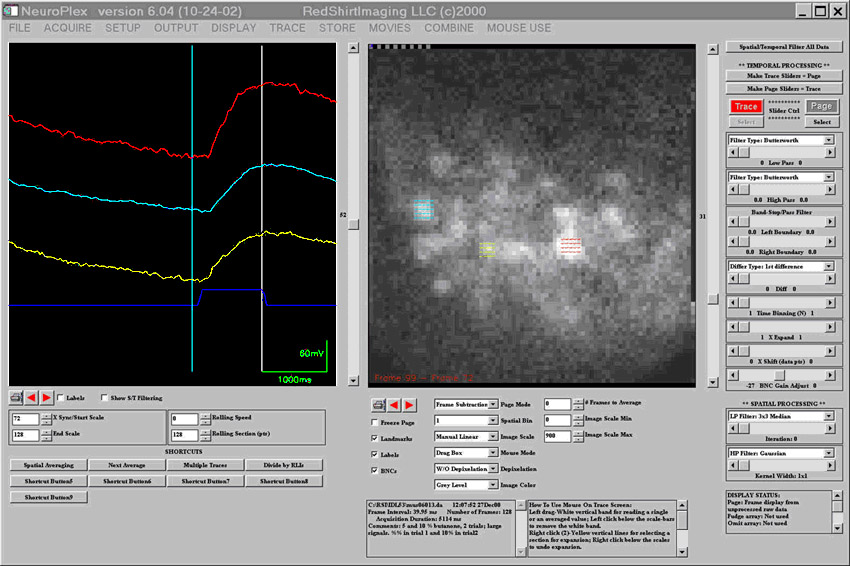
 NeuroPlex's first
user interface (shown at left, Enlarge) for analysis contains two
windows for viewing data. The right window, called the Page Display,
displays data from all pixels as they are positioned in the array. The
Trace Display (left window) provides a larger view of data from a
reduced number of pixels or electrode inputs. Pixels can be selected
for this more detailed examination by pointing and clicking on the
traces in the Page Display. A variety of low- and high-pass filters and
display adjustments are available for each display.
NeuroPlex's first
user interface (shown at left, Enlarge) for analysis contains two
windows for viewing data. The right window, called the Page Display,
displays data from all pixels as they are positioned in the array. The
Trace Display (left window) provides a larger view of data from a
reduced number of pixels or electrode inputs. Pixels can be selected
for this more detailed examination by pointing and clicking on the
traces in the Page Display. A variety of low- and high-pass filters and
display adjustments are available for each display.
The Trace Display also provides additional controls for averaging over
diodes, superimposing and scaling traces.
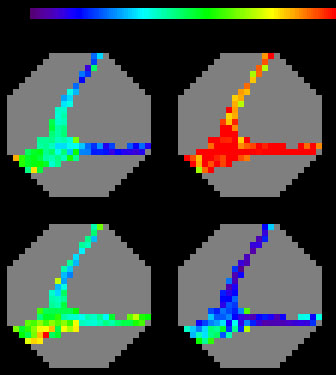
 The
second analysis interface within NeuroPlex provides pseudocolor
displays of the data (shown at right, Enlarge). Options for pseudocolor
image displays include single frame, multiple frame, and movie displays
of the time series. For anatomical reference, the pseudocolor images
can be overlaid on an image of the preparation. A variety of color
schemes, scaling, and filtering options are available. The
second analysis interface within NeuroPlex provides pseudocolor
displays of the data (shown at right, Enlarge). Options for pseudocolor
image displays include single frame, multiple frame, and movie displays
of the time series. For anatomical reference, the pseudocolor images
can be overlaid on an image of the preparation. A variety of color
schemes, scaling, and filtering options are available.
Additional information

Two different
kinds of data display are provided. The first is intensity vs. time for
the individual detectors and the second is a simultaneous pseudocolor
display of intensity for all detectors at a particular time. A long
series of such pseudocolor frames can be played as a movie.
Intensity
VS. Time:
There are two
display windows on the main NeuroPlex widget. The Page Display displays
intensity versus time for all detectors (plus 8 BNC channels) in the
arrangement of the photodiode array. The individual traces can be
displayed with an enlargement on the Trace Display by clicking them
individually on the Page Display. The two displays can be filtered and
processed separately. In addition to the usual X and Y gain
adjustments, the following kinds of high- and low- pass filtering are
available:
· Gaussian,
· Butterworth,
· median,
· RC,
· and binomial.
Traces can be
displayed as intensity change ( I) vs. time or as fractional intensity
change ( I/I) vs. time.
The Page Display can
be modified by a fudge array (replaces bad detectors with the average
of the four adjacent detectors) or an omit array (replaces detectors
with no signal with a flat line).
The
Trace Display can display:
1. The spatial
averages of selected traces,
2. The FFT of selected traces,
3. The correlation between traces,
4. Spaced or superimposed traces,
5. Superimposed traces can be scaled to equal height for comparing time
courses, and
6. Both the Page display and the Trace display can be exported as a
TIFF file, a PostScript file or an ASCII file.
Pseudo-Color Frames:
The filtered data
can be made into pseudocolor movie frames and then be viewed as
individual frames, or multiple frames in one window, or as an animated
movie. The color of the frames can be manipulated by using different
color tables and four different scaling schemes.
The
scaling schemes are:
· Variable (each
detector will have the maximum and the minimum color at some time in
the trial),
· Fixed; using the trace with the largest signal,
· Fixed; using a user chosen detector, and
· Manual.
(When you've tried all these options, it will be clear why it is called
pseudo-color).
The
movie frames can also be overlayed onto a high resolution CCD image of
the preparation by importing its TIFF or BMP file. The movie can be
saved as a movie file and the file can then be read and replayed by
NeuroPlex. The display on the movie window can be exported as a TIFF
|